L o a d i n g

h-factor Investment

Solving decision making experience for a fintech product

Web Dashboard
Category :
My Role
Senior UX/UI Designer
Primary users
Investors, Financial Advisors, Portfolio Managers
62%
Task Completion Rate

Overview

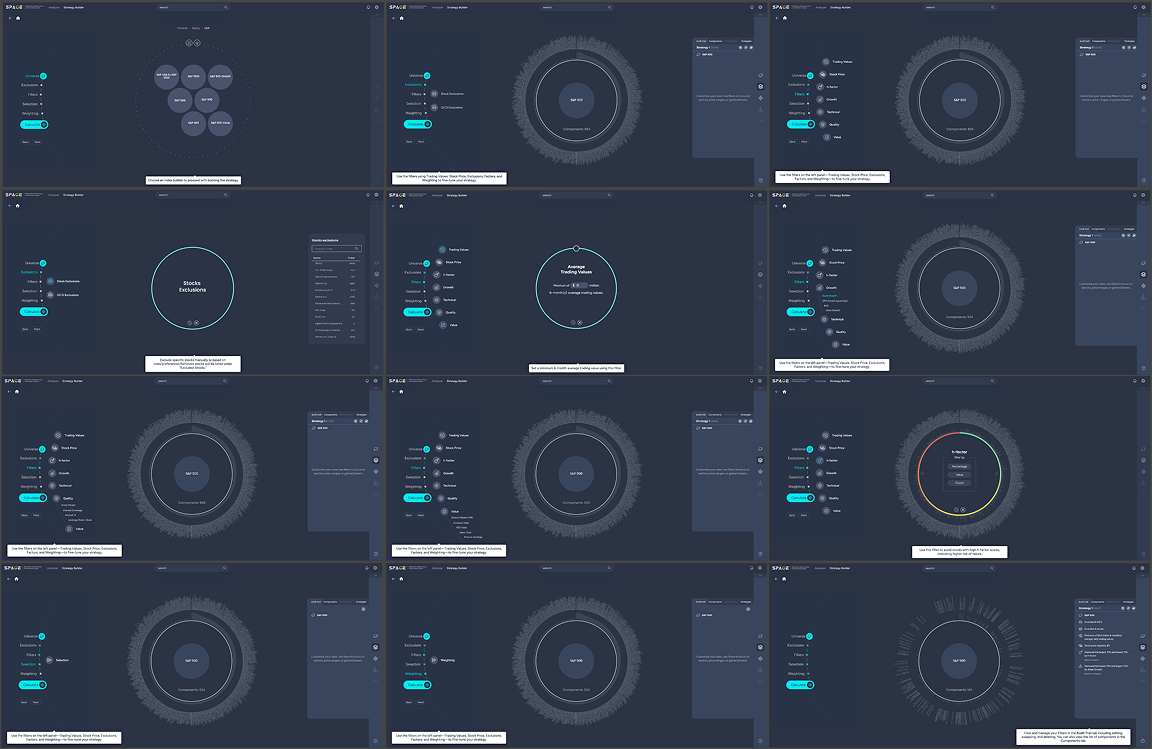
h-factor is a decision-support platform that helps investors avoid overpriced stocks by calculating a 0–100% risk score showing the likelihood a company will fail to deliver its implied revenue growth.

The product had strong data and a distinctive circular visualization, but users struggled to turn insights into decisions leading to hesitation, drop-offs, and low adoption.

The Problem

  • Users trusted the math, but not themselves
  • Frequent questions:
  • “What do I do next?”
  • “Why did stocks disappear?”
  • “Did I break something?”
  • Strategy Builder caused silent failures and abandonment
  • The circle looked powerful but felt passive

This wasn’t a UI polish problem - it was a decision-confidence problem.

Research & Approach

Instead of over-engineering analytics, I focused on methods that directly exposed decision friction:

  • Task-based usability testing (primary)
  • Funnel & confidence leakage analysis
  • Control vs redesign comparison
  • Qualitative diagnosis (think-aloud)
  • Post-fix cohort analysis
  • Lightweight A/B validation

Heavy predictive or Bayesian analysis was intentionally avoided - they wouldn’t have addressed the core UX failures.

Key Insights

  • The circle was respected, not understood
  • Percentages alone didn’t create confidence
  • Silent failures destroyed trust
  • Drop-offs were caused by uncertainty, not lack of data

Design Solution

  • Circle → Decision Engine: Made state-aware and responsive to user actions
  • Panels → Narrative Support: Each panel answered one clear question and surfaced “what’s next”
  • Strategy Builder → Guided Execution: Visible rules, step readiness, and explainable errors

Design principles:

  • Always answer “What’s next?”
  • Show cause and effect
  • Guide without taking control
  • Design for confidence, not speed alone

Results & Impact

  • Task Completion
  • Strategy Builder completion: 18% → 62%
  • Decision completion: 29% → 76%

Speed

  • Time-to-decision reduced by - 40%

Retention (UX-validated)

  • Intent to return: +29 pts
  • Repeat strategy creation: 2×

Confidence (1–5 scale)

  • Investors: 2.4 → 4.0
  • Advisors: 2.8 → 4.2
  • Portfolio Managers: 3.1 → 4.5

Final Outcome

The h-factor platform evolved from a visually impressive but intimidating system into a trusted decision-support tool.

Users didn’t just understand risk better - they acted with confidence.

“ When decisions carry real consequences, clarity matters more than complexity.”